Here are some specific activities, investigations or visual aids we have picked out. Click anywhere in the grey area to access the resource. The options may go beyong the scope of this level of the Functional Skills requirements.
 Averages Video Revise how to calculate the mean, median, mode and range from lists and frequency tables.
 Averages Test your understanding of averages with this self marking quiz about mean, median and range.
 Choose Your Average This is a game for two players. You should know how to find the mean, median and range of a set of numbers.
 Mixed Medians Find the medians of sets of different types of numbers in these self-marking exercises.
 StatGrid Challenge Arrange the numbers one to nine in a three by three grid to obtain the given means, medians and ranges.
 Statistics Supplied Find all of the sets of numbers matching the given statistical conditions.
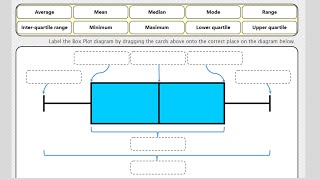 Box Plots Video Box plots, sometimes called box and whisker diagrams, are a useful way of visualising data.
 Box Plots An exercise on reading and drawing box-and-whisker diagrams which represent statistical data.
Here are some exam-style questions on this statement:
- "The range, mode, median and mean of five positive integers are all equal to 8. Find two different possible sets of these five integers." ... more
- "There is a total of 60 students in the school orchestra." ... more
- "The following table shows the time taken by fifty people to answer their emails one day." ... more
- "A basket contains apples and oranges. The mean weight of the 9 apples in the basket is 265g. The mean weight of all 21 items of fruit in the basket is 290g." ... more
- "The following table show data collected by a researcher about the length of monitor lizards living in a park in Bangkok." ... more
Click on a topic below for suggested lesson Starters, resources and activities from Transum.
- Averages "Average" is a very general term that is used commonly in everyday English and most people have an idea what it means. Mathematicians like to be a little more precise however and have come up with a number of different ways of finding a measure of central tendency. Pupils at school should develop their understanding of averages so that they can more precisely communicate information to others and are not misled by statistics presented in a way to distort the facts. Pupils should understand and use the mean of discrete data. They should be able to compare two simple distributions using the range and one of the mode, median or mean. See also the topics called Data Handling and Statistics.
- Statistics Statistics is the study of the collection, organisation, analysis, interpretation and presentation of data. It deals with all aspects of data, including the planning of data collection in terms of the design of surveys and experiments. It also includes describing mathematical relationships between variables and presenting these to an audience in a way that best conveys meaning. See also the topics called Data Handling, Probability and Averages.
How do you teach this topic? Do you have any tips or suggestions for other teachers? It is always useful to receive feedback and helps make these free resources even more useful for Maths teachers anywhere in the world. Click here to enter your comments.