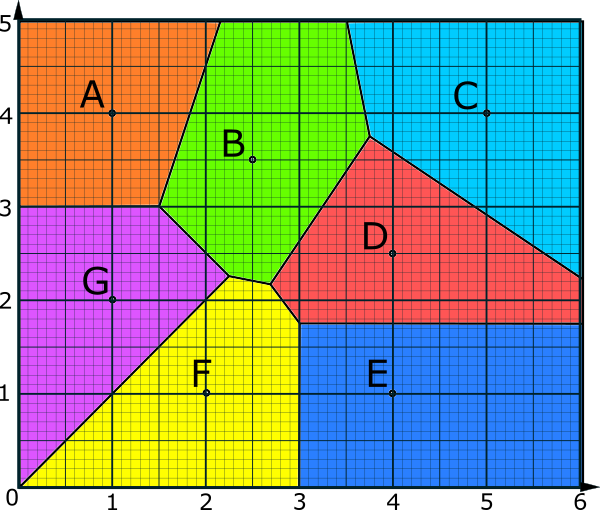
9. Each of the coloured regions in the diagram is called a cell. Each cell shows all of the locations that are closer to the site it containes than to any other site.
Check
© Transum Mathematics 1997-2025
https://www.Transum.org/go/?Num=850
Description of Levels
Close
Perpendicular Bisector - A step-by-step guide showing how to construct the perpendicular bisector of a line segment. This skill can then be used to construct a Voronoi Diagram.
Printable Worksheet : Get a real 'feel' for Voronoi diagrams with this resource on which you can draw Voronoi diagrams using the good, old-fashioned compasses, pencil and ruler method.
Level 1 - General questions about a diagram of a rectangular shaped island.
Level 2 - Questions involving the vocabulary and mathematics of Voronoi diagrams.
Level 3 - Find the coordinates of the missing sites in ten Voronoi Diagrams.
Level 4 - Define a region on a Voronoi Diagrams by finding the equations of the edges.
Exam Style Questions - A collection of problems in the style of IB exam paper questions.
More on Loci including lesson Starters, visual aids, investigations and self-marking exercises.
Curriculum Reference
The video above is from Revision Village.
Definitions
Sites: These are the important locations from which the positions of the lines of the Voronoi diagram are calculated.
Cells: These are the areas that surround the sites and contain the points which are closer to that site than to any other site. The cells are labelled according to the site which they contain. They are also known as regions.
Edges: These are the borders between the cells. They are the lines showing the points equidistant from pairs of sites.
Vertices: A vertex is the point at which three or more edges meet. Each vertex is equally close to the sites whose cells meet at that vertex. They can also be called intersections.
Nearest Neighbour interpolation is a simple method of estimating the value of a variable at any point by using the variable's value at the nearest site.
Toxic Dump Problem: This problem can be described as finding the optimal position for a toxic waste dump, so as to maximise its distance from the nearest town. If not on the border of the diagram the location will always be at one of the vertices.
Don't wait until you have finished the exercise before you click on the 'Check' button. Click it often as you work through the questions to see if you are answering them correctly. You can double-click the 'Check' button to make it float at the bottom of your screen.
Close


