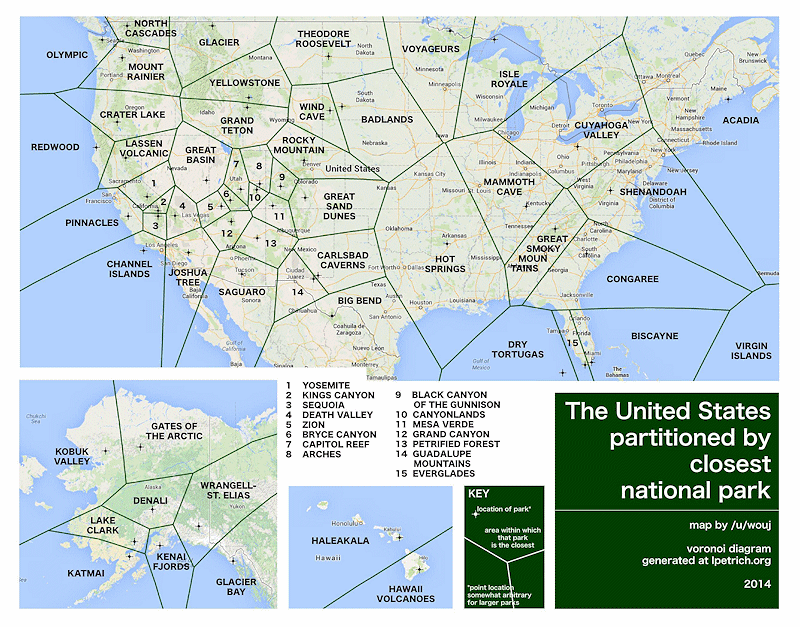
This is the third part of a number of different activities involving Voronoi diagrams.
There is a printable worksheet on which you can draw Voronoi diagrams using the good, old-fashioned compasses, pencil and ruler method:

For Whole ClassStraight Line Graphs 10 straight line graph challenges for use with computer graph plotting software or a graphical display calculator. |
RelatedGraph Match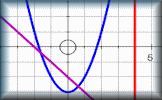 Match the equations with the images of the corresponding graphs. Linear, quadratic and more. |
Just For FunHuman Graphs Students should be encouraged to stand up and make the shapes of the graphs with their arms. |
SuggestedPlotting Graphs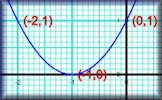 Complete a table of values then plot the corresponding points to create a linear, quadratic or reciprocal graph. |
The solutions to this and other Transum puzzles, exercises and activities are available in this space when you are signed in to your Transum subscription account. If you do not yet have an account and you are a teacher or parent you can apply for one here.
A Transum subscription also gives you access to the 'Class Admin' student management system and opens up ad-free access to the Transum website for you and your pupils.
Can you think of a reason why the Voronoi diagram below contains curved edges?
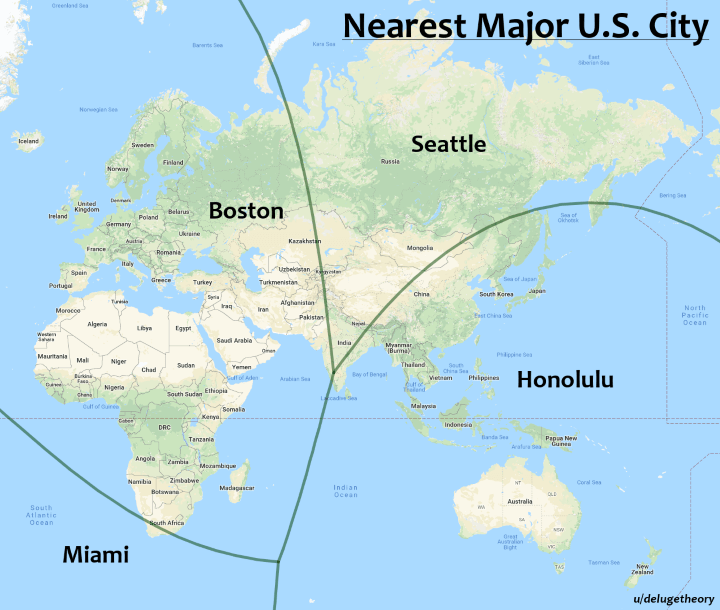
Diagram created by delugetheory with more details on Brilliant Maps.