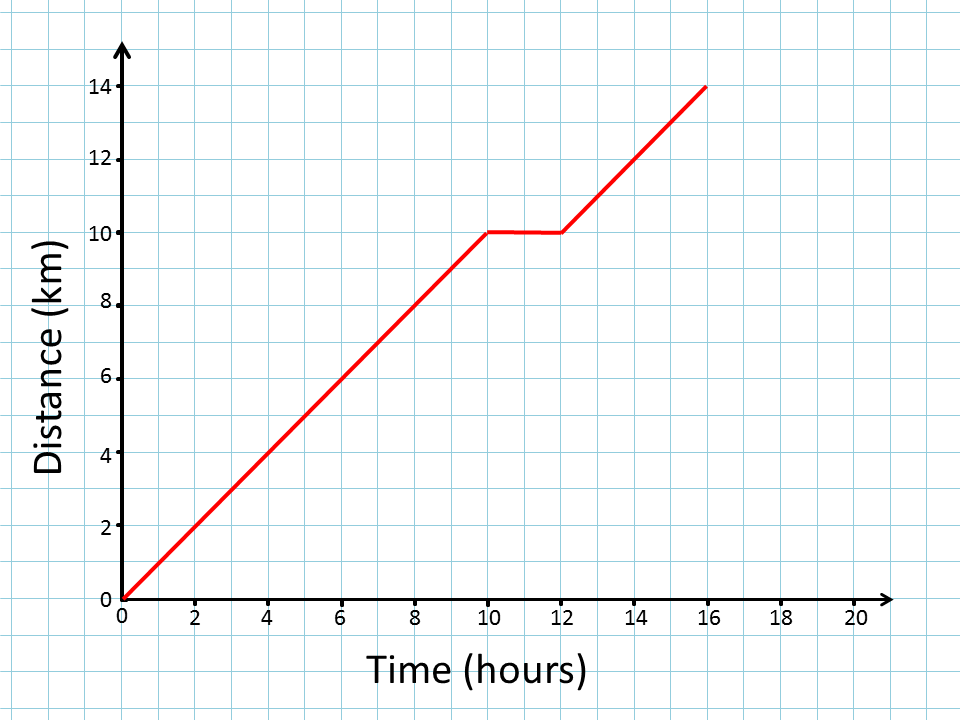
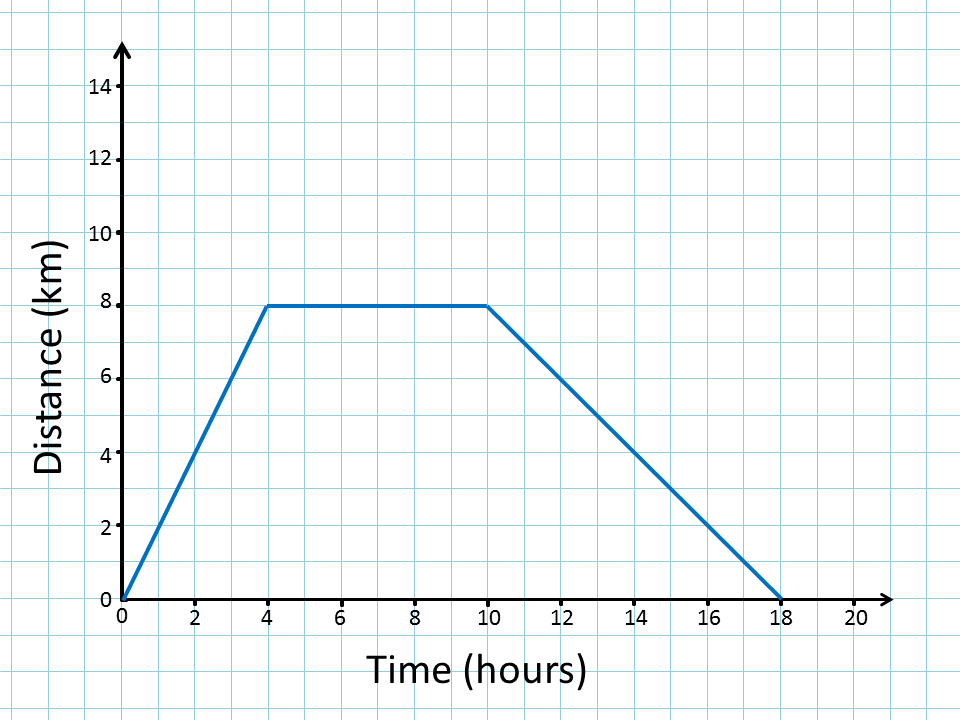
Describe the distance time graphs below
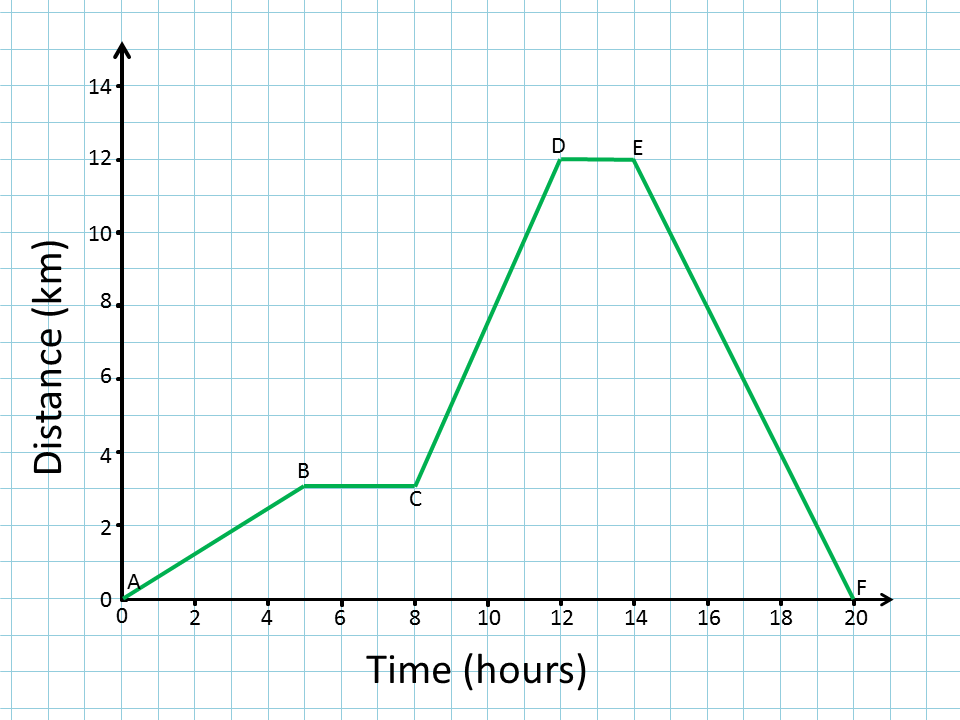
Describe the distance time graphs below
|
Recently UpdatedStem and Leaf Diagrams Practise your ability to read and construct stem-and-leaf diagrams for statistical data. So far this activity has been accessed 26 times and 3 people have earned a Transum Trophy for completing it. |
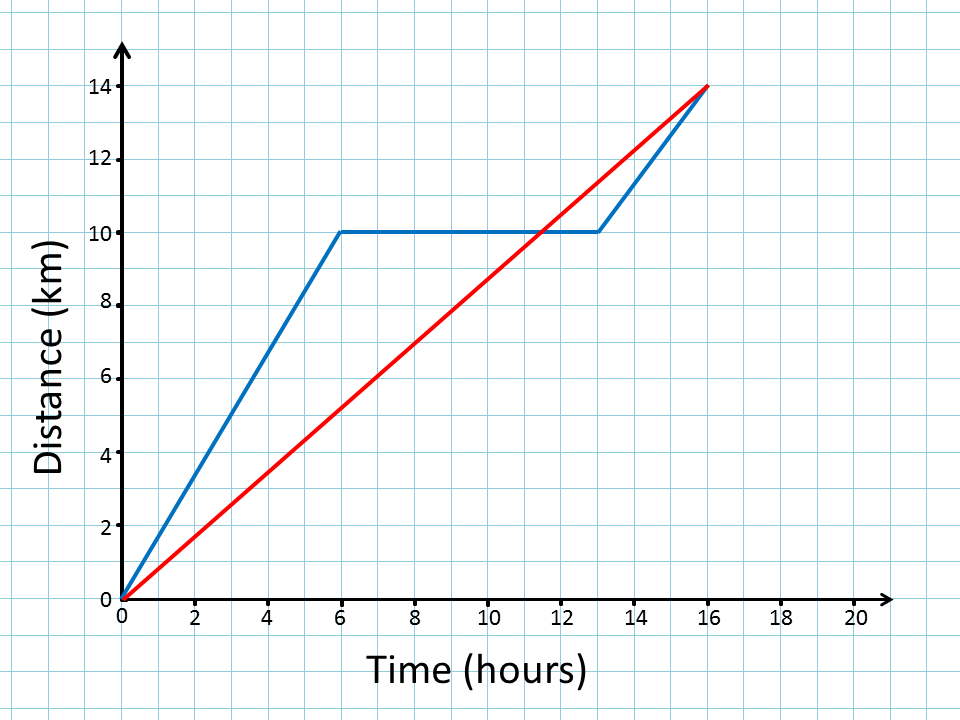
Distance Time GraphsA visual aid for a teacher to use in a Mathematics lesson showing distance time graphs.If your students are new to distance-time graphs you might like to begin with the 'Helicopter View' animation. Class discussion might illuminate the fact that the steepness or gradient of the line graph is related to the speed of the vehicle. A positive gradient indicates a velocity away from the reference point while a negative gradient represents a velocity in the opposite direction. A gradient of zero represents the vehicle coming to rest. In the real world a more accurate graph of the situation would be a smooth curve rather than a number of straight lines. After viewing the graphs above have a look at the Hurdles Race for some fun. |
|
|
Do you have any comments? It is always useful to receive feedback and helps make this free resource even more useful for those learning Mathematics anywhere in the world. Click here to enter your comments. |
||