The graph of y= f(x) for 0 ≤ x ≤ 12 shown in red below, consists of straight lines and a semicircle.
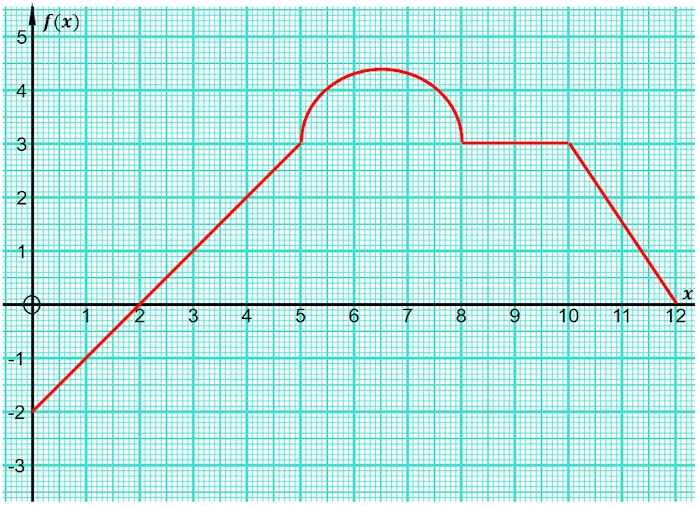
Find exact values for:

The graph of y= f(x) for 0 ≤ x ≤ 12 shown in red below, consists of straight lines and a semicircle.

Find exact values for:

Topics: Starter
How did you use this starter? Can you suggest
how teachers could present or develop this resource? Do you have any comments? It is always useful to receive
feedback and helps make this free resource even more useful for Maths teachers anywhere in the world.
Click here to enter your comments.
Previous Day | This starter is for | Next Day
More Mathematics Lesson Starters
How did you use this resource? Can you suggest how teachers could present, adapt or develop it? Do you have any comments? It is always useful to receive feedback and helps make this free resource even more useful for Maths teachers anywhere in the world. Click here to enter your comments.
Christmas Present Ideas
It is often very difficult choosing Christmas presents for family and friends but so here are some seasonal, mathematics-related gifts chosen and recommended by Transum Mathematics.
|
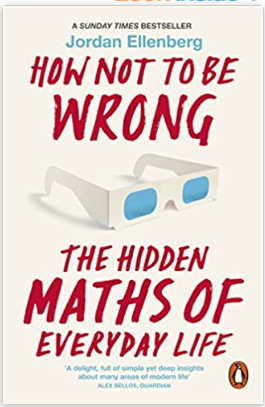
How Not To Be WrongThe maths we learn in school can seem like an abstract set of rules, laid down by the ancients and not to be questioned. In fact, Jordan Ellenberg shows us, maths touches on everything we do, and a little mathematical knowledge reveals the hidden structures that lie beneath the world's messy and chaotic surface. In How Not to be Wrong, Ellenberg explores the mathematician's method of analyzing life, from the everyday to the cosmic, showing us which numbers to defend, which ones to ignore, and when to change the equation entirely. Along the way, he explains calculus in a single page, describes Gödel's theorem using only one-syllable words, and reveals how early you actually need to get to the airport. What more could the inquisitive adult want for Christmas? This book makes a cosy, interesting read in front of the fire on those cold winter evenings. more... #ad |
||||
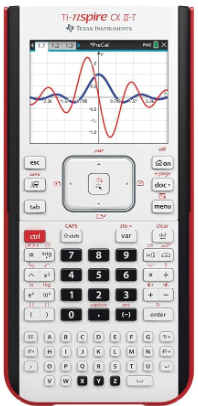
Graphic Display CalculatorThis handheld device and companion software are designed to generate opportunities for classroom exploration and to promote greater understanding of core concepts in the mathematics and science classroom. TI-Nspire technology has been developed through sound classroom research which shows that "linked multiple representation are crucial in development of conceptual understanding and it is feasible only through use of a technology such as TI-Nspire, which provides simultaneous, dynamically linked representations of graphs, equations, data, and verbal explanations, such that a change in one representation is immediately reflected in the others. For the young people in your life this is a great investment. Bought as a Christmas present but useful for many years to come as the young person turns into an A-level candidate then works their way through university. more... #ad |
|
||||

|
Apple iPad ProThe analytics show that more and more people are accessing Transum Mathematics via an iPad as it is so portable and responsive. The iPad has so many other uses in addition to solving Transum's puzzles and challenges and it would make an excellent gift for anyone. The redesigned Retina display is as stunning to look at as it is to touch. It all comes with iOS, the world's most advanced mobile operating system. iPad Pro. Everything you want modern computing to be. more... #ad Before giving an iPad as a Christmas gift you could add a link to iPad Maths to the home screen. |
||||
Craig Barton's Tips for TeachersTeaching is complex. But there are simple ideas we can enact to help our teaching be more effective. This book contains over 400 such ideas." more... #ad "The ideas come from two sources. First, from the wonderful guests on his Tips for Teachers podcast - education heavyweights such as Dylan Wiliam, Daisy Christodoulou and Tom Sherrington, as well as talented teachers who are not household names but have so much wisdom to share. Then there's what he has learned from working with amazing teachers and students in hundreds of schools around the world. |

|
||||

|
More Tips For TeachersThe Tips for Teachers guide to… series is Craig Barton's attempt to distil the ideas he learned into actionable steps you can implement the very next time you step into a classroom. His criterion for including an idea in this series is that he must have seen it used effectively at least three times in three different schools. Craig delivers yet another perfect Christmas gift more... #ad |
||||
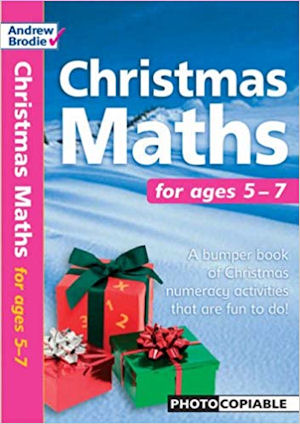
Christmas MathsThis book provides a wealth of fun activities with a Christmas theme. Each photocopiable worksheet is matched to the Numeracy Strategy and compatible with the Scottish 5-14 Guidelines. This series is designed for busy teachers in the late Autumn term who are desperate for materials that are relevant and interesting and that can be completed with minimun supervision. All the activities are suitable for use by class teachers, supply teachers, SEN teachers and classroom assistants and cover topics such as 'How many partridges did the true love give all together?' and 'Filling a sleigh with presents by rolling a dice!'. Children will have lots of fun working through the Christmas Maths themes but also gain valuable skills along the way. A great source of ideas and another reasonably priced stocking filler. more... #ad |
|
||||
|
A Compendium Of Mathematical MethodsHow many different methods do you know to solve simultaneous equations? To multiply decimals? To find the nth term of a sequence? A Compendium of Mathematical Methods brings together over one hundred different approaches from classrooms all over the world, giving curious mathematicians the opportunity to explore fascinating methods that they've never before encountered. If you teach mathematics to any age group in any country, you are guaranteed to learn lots of new things from this delightful book. It will deepen your subject knowledge and enhance your teaching, whatever your existing level of expertise. It will inspire you to explore new approaches with your pupils and provide valuable guidance on explanations and misconceptions. more... #ad |
||||
Math with Bad DrawingsI had been tutoring the wonderful Betsy for five years. When the day came for our last ever session together before the end of her Year 13, I received this beautiful book as a gift of appreciation. This a very readable book by Ben Orlin. I'm really enjoying the humour in the writing and the drawings are great. Ben Orlin answers maths' three big questions: Why do I need to learn this? When am I ever going to use it? Why is it so hard? The answers come in various forms-cartoons, drawings, jokes, and the stories and insights of an empathetic teacher who believes that mathematics should belong to everyone. more... #ad |
|
||||
Click the images above to see all the details of these gift ideas and to buy them online.
Your access to the majority of the Transum resources continues to be free but you can help support the continued growth of the website by doing your Amazon shopping using the links on this page. Below is an Amazon link. As an Amazon Associate I earn a small amount from qualifying purchases which helps pay for the upkeep of this website.
Educational Technology on Amazon