 |
Exam-Style Question on StatisticsA mathematics exam-style question with a worked solution that can be revealed gradually |
Question id: 108. This question is similar to one that appeared on an IB Studies paper in 2014. The use of a calculator is allowed.
The following grouped frequency table shows the length of time, \(t\), in minutes, visitors watched an octopus swimming around a tank at an aquarium.
| Time (\(t\)) | Visitors |
|---|---|
| \(0\lt t \le 5\) | 23 |
| \(5\lt t \le 10\) | 13 |
| \(10\lt t \le 15\) | 9 |
| \(15\lt t \le 20\) | 6 |
| \(20\lt t \le 25\) | 2 |
| \(25\lt t \le 30\) | 1 |
(a) Write down the total number of visitors who were included in the survey.
(b) Write down the mid-interval value for the \(20\lt t \le 25\) group.
(c) Find an estimate of the mean time visitors took watching the octopus.
The information above has been rewritten as a cumulative frequency table.
| Time (\(t\)) | \(t \le 5\) | \(t \le 10\) | \(t \le 15\) | \(t \le 20\) | \(t \le 25\) | \(t \le 30\) |
|---|---|---|---|---|---|---|
| Cumulative frequency | 23 | 36 | \(a\) | 51 | 53 | \(b\) |
(d) Write down the values of \(a\) and \(b\).
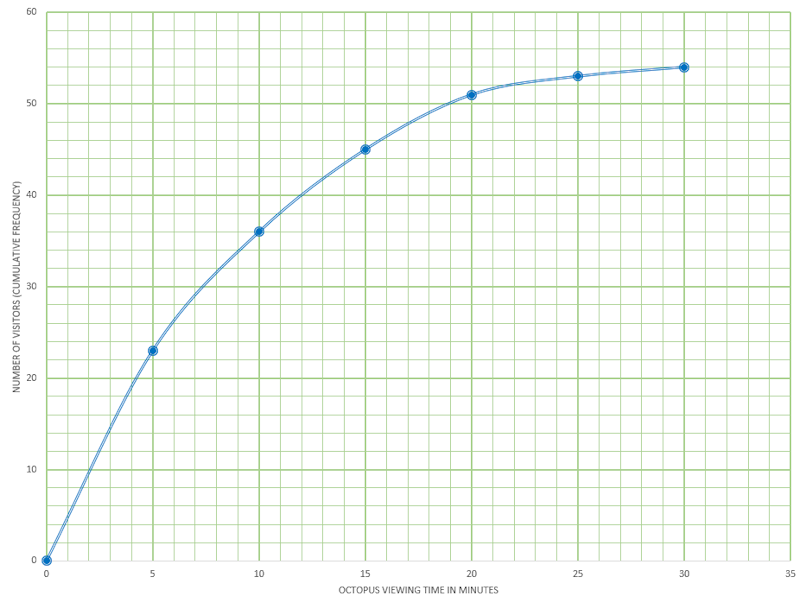
This information is shown in the following cumulative frequency graph.

(e) Use the graph to estimate the maximum time taken watching the octopus for the first 32 visitors (arranged in order of increasing viewing time).
(f) Use the graph to estimate the number of visitors who spent less than 13 minutes watching the octopus.
(g) Use the graph to estimate the number of visitors who take more than 17 minutes watching the octopus.
|
The worked solutions to these exam-style questions are only available to those who have a Transum Subscription. Subscribers can drag down the panel to reveal the solution line by line. This is a very helpful strategy for the student who does not know how to do the question but given a clue, a peep at the beginnings of a method, they may be able to make progress themselves. This could be a great resource for a teacher using a projector or for a parent helping their child work through the solution to this question. The worked solutions also contain screen shots (where needed) of the step by step calculator procedures. A subscription also opens up the answers to all of the other online exercises, puzzles and lesson starters on Transum Mathematics and provides an ad-free browsing experience. |

|

Drag this panel down to reveal the solution
Here are some simpler exercises on finding the mean from a table and other Averages.
The exam-style questions appearing on this site are based on those set in previous examinations (or sample assessment papers for future examinations) by the major examination boards. The wording, diagrams and figures used in these questions have been changed from the originals so that students can have fresh, relevant problem solving practice even if they have previously worked through the related exam paper.
The solutions to the questions on this website are only available to those who have a Transum Subscription.
Exam-Style Questions Main Page
To search the entire Transum website use the search box in the grey area below.
©1997 - 2026 Transum Mathematics :: For more exam-style questions and worked solutions go to Transum.org/Maths/Exam/