 |
Exam-Style Questions.Problems adapted from questions set for previous Mathematics exams. |
1. | GCSE Higher |
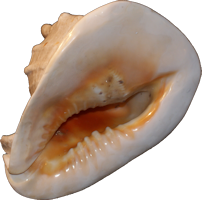
Ben measured the length and the width of each of 10 sea shells of the same type. The results are shown below.
(a) Construct a scatter graph with this data.

| Sea Shell Dimensions | |
| Length(cm) | Width(cm) |
| 7.3 | 2.7 |
| 9.7 | 3.2 |
| 7.5 | 2.6 |
| 6.1 | 2.9 |
| 9.0 | 2.9 |
| 8.7 | 3.0 |
| 7.5 | 2.5 |
| 10.3 | 3.5 |
| 9.5 | 3.3 |
The point representing the results for one of the shells is an outlier.
(b) Explain how the results for this shell differ from the results for the other shells.
2. | GCSE Higher |
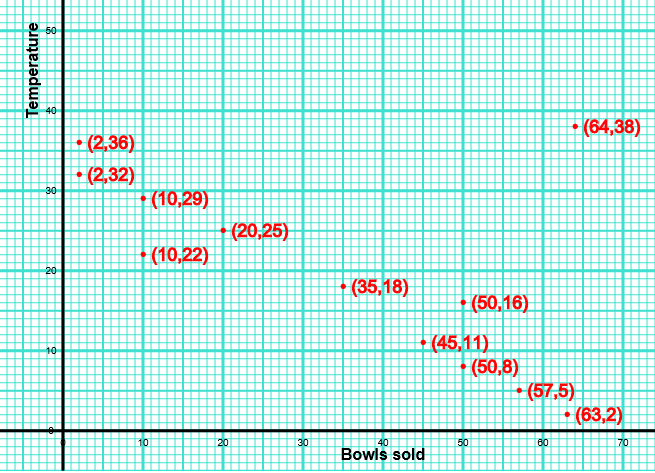
The scatter graph shows the maximum temperature (oC) and the number of bowls of soup sold at a sandwich shop on twelve randomly selected days last year.

(a) One of the points is an outlier. What temperature does this outlier represent.
(b) For all the other points write down the type of correlation.
(c) On another day of the year, the temperature was 20oC. Estimate the number of bowls of soup sold on that day.
(d) The shop owner says "We sell more bowls of soup the higher the temperature". Does the scatter graph support this statement? Give a reason for your answer.
If you would like space on the right of the question to write out the solution try this Thinning Feature. It will collapse the text into the left half of your screen but large diagrams will remain unchanged.
The exam-style questions appearing on this site are based on those set in previous examinations (or sample assessment papers for future examinations) by the major examination boards. The wording, diagrams and figures used in these questions have been changed from the originals so that students can have fresh, relevant problem solving practice even if they have previously worked through the related exam paper.
The solutions to the questions on this website are only available to those who have a Transum Subscription.
Exam-Style Questions Main Page
To search the entire Transum website use the search box in the grey area below.