 |
Exam-Style Questions.Problems adapted from questions set for previous Mathematics exams. |
1. | IB Standard |
Consider the graph of \(f(x)=a\sin(b(x+c))+12\), for \(0\le x\le 24\).
The graph has a maximum at (8, 22) and the next local minimum at (18, 2).
(a) Find the value of \(a\).
(b) Find the value of \(b\).
(c) Find the value of \(c\).
(d) Solve \(f(x)=5\).
2. | IB Analysis and Approaches |
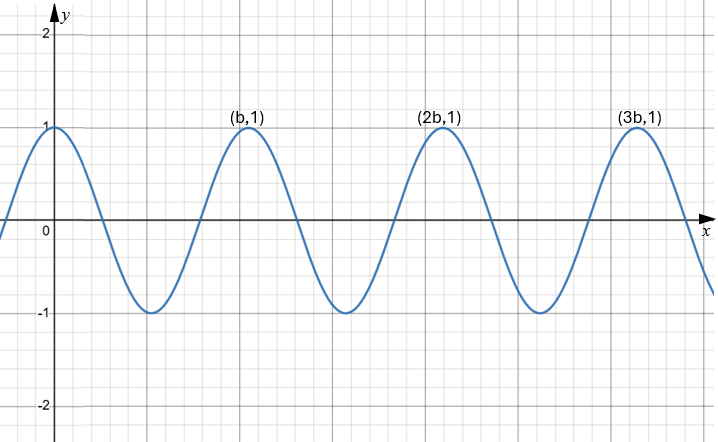
The function \(f\) is defined by \(f(x) = \cos{ax} \) , where \(a > 0\). The following diagram shows part of the graph of \(f\), where x is in radians. There are local maxima at \(x = b , 2b \text{ and } 3b\).

(a) Find an expression for \(b\) in terms of \(a\).
The function \(g\) is defined by \(g(x) = 2\cos{ \dfrac{bx}{3}} \)
(b) On the axes above, sketch the graph of \(g\).
3. | IB Standard |
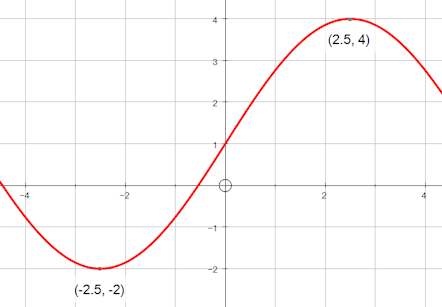
The diagram shows part of the graph of \(y=a\sin{(bx)}+c\) with a minimum at \((-2.5,-2)\) and a maximum at \((2.5,4)\).

(a) Find \(a\).
(b) Find \(b\).
(c) Find \(c\).
4. | IB Standard |
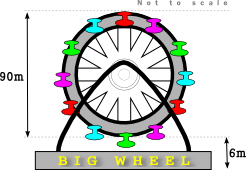
The Big Wheel at Fantasy Fun Fayre rotates clockwise at a constant speed completing 15 rotations every hour. The wheel has a diameter of 90 metres and the bottom of the wheel is 6 metres above the ground.

A cabin starts at the bottom of the wheel with the top of the cabin 6m above the ground.
(a) Find the greatest height of the top of the cabin reaches as the wheel rotates.
After \(t\) minutes, the height \(h(t)\) metres above the ground of the top of a cabin is given by the function \(h(t)=51-a\cos bt\).
(b) Find the period of \(h(t)\)
(c) Find the value of \(b\).
(d) Find the value of \(a\).
(e) Sketch the graph of \(h(t)\) , for \(0\le t\le 5\).
(f) In one rotation of the wheel, find the probability that a randomly selected seat is at least 70 metres above the ground. Give your answer to two decimal places.
5. | IB Standard |
The population of sheep on a ranch is modelled by the function \(P(t)= 65 \sin(0.4t-32)+450\), where t is in months, and \(t=1\) corresponds to 1st January 2015.
(a) Find the number of sheep on the ranch on 1st July 2015.
(b) Find the rate of change of the sheep population on 1st July 2015.
(c) Explain your answer to part (b) with reference to the sheep population size on 1st July2015.
6. | IB Analysis and Approaches |
The Fun Wheel at the Meller Theme Park rotates at a constant speed.

The height, \(h\) metres, of the point initially at the top of the circumference of the wheel after \(t\) minutes is given by:
$$ h(t) = a \cos(bt) + c $$(a) Find the values of \(a, b \text{ and } c \text{ where } a,b,c \in \mathbb{R} \).
(b) Draw a sketch of the function \(h(t)\) for \(0 < t < 4 \).
7. | IB Standard |
(a) Sketch the graph of \(f(x) = 4\sin x - 5\cos x \), for \(–2\pi \le x \le 2\pi \).
(b) Find the amplitude of \(f\).
(c) Find the the period of \(f\).
(d) Find the \(x\)-intercept that lies between 0 and 3.
(e) Hence write \(f(x)\) in the form \(a \sin (bx + c) \).
(f) Write down one value of \(x\) such that \(f'(x) = 0 \).
(g) Write down the two values of \(p\) for which the equation \(f(x) = p\) has exactly two solutions.
8. | IB Standard |
Let \(f(x)=\sin ( \frac {\pi}{4}x) + \cos ( \frac {\pi}{4}x) \), for \(-4\le x \le 4\)
(a) Sketch the graph of \(f\).
(b) Find the values of \(x\) where the function is decreasing.
(c) The function \(f\) can also be written in the form \(f(x)=a\sin ( \frac {\pi}{4}(x+c))\) where \(a\in \mathbb R\) and \(0 \le c \le 2\). Find the value of \(a\) and \(c\).
9. | IB Analysis and Approaches |
Consider a function \(f\), such that \(f(x)=7.2\sin(\frac{\pi}{6}x + 2) + b\) where \( 0\le x \le 12\)
(a) Find the period of \(f\).
The function \(f\) has a local maximum at the point (11.18,10.3) , and a local minimum at (5.18.-4.1).
(b) Find the value of b.
(c) Hence, find the value of \(f(7)\).
A second function \(g\) is given by \(g(x)=a\sin(\frac{2\pi}{7}(x -4)) + c\) where \(0 \le x \le 10\)
The function \(g\) passes through the points (2.25,-3) and (5.75,7).
(d) Find the value of \(a\) and the value of \(c\).
(e) Find the value of x for which the functions have the greatest difference.
10. | IB Analysis and Approaches |
A carriage attached to a tall vertical pole in an amusement park ride whisks customers up and down. The height, \(H\) metres, of the base of the carriage above the ground can be modelled by the function \(H(t) = a\cos(0.4t) + b\), for \(a, b \in \mathbb{R}\) and \(t\) is the time in seconds after the ride starts.
(a) Find the period of the function.

The ride begins when its base is at a minimum height of 1 metre above the ground, and it reaches a maximum height of 31 metres above the ground.
(b) Find the values of a and b.
(c) Find the number of times that the carriage reaches its maximum height in the first minute of its motion.
(d) Find the first time that the base of the carriage reaches a height of 15 metres.
A camera is set to take a picture of the ride at a random time during the first 15 seconds of its motion.
(e) Find the probability that the height of the base of the carriage is greater than 10 metres at the time the picture is taken.
11. | A-Level |
The height above the ground, H metres, of a passenger on a Ferris wheel t minutes after the wheel starts turning, is modelled by the following equation:
$$H = k – 8\cos (60t)° + 5\sin (60t)°$$where k is a constant.
(a) Express \(H\) in the form \(H = k - R \cos(60t + a)° \) where \(R\) and \(a\) are constants to be found (\( 0° \lt a \lt 90° \)).
(b) Given that the initial height of the passenger above the ground is 2 metres, find a complete equation for the model.
(c) Hence find the maximum height of the passenger above the ground.
(d) Find the time taken for the passenger to reach the maximum height on the fifth cycle. (Solutions based entirely on graphical or numerical methods are not acceptable.)
(e) It is decided that, to increase profits, the speed of the wheel is to be increased. How would you adapt the equation of the model to reflect this increase in speed?
12. | IB Analysis and Approaches |
The height of water in metres above Chart Datum* in the Port of Bristol on a day in January is modelled by the function:
$$H(x) = a \sin(b(x-c)) +d$$where \(x\) is the number of hours after midnight GMT, and \(a,b,c, \text{ and } d \) are constants greater than zero.
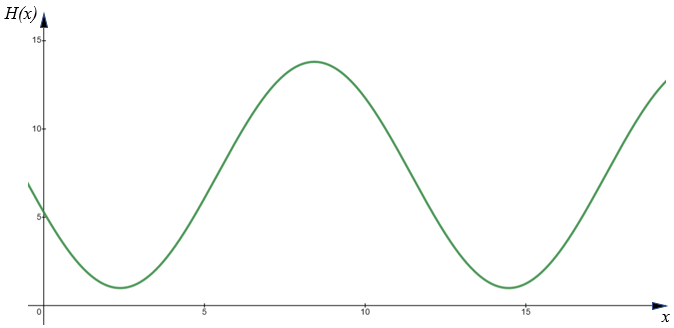
The following graph shows the height of the water for 19 hours starting at midnight.

The first low tide occurs at 02:23 and next low tide occurs at 14:28.
Throughout the day the height of the water fluctuates between 1m and 13.8m.
(a) Show that \(a = 6.4\).
(b) Find the value of \(b\) to two decimal places.
(c) Find the value of \(d\).
(d) Find the smallest possible value of \(c\) to one decimal place.
(e) Using the values of \(a,b,c, \text{ and } d \) found above, find the height of the water at 10:00.
(f) Determine the number of hours, during this January day, for which the tide is higher than 10 metres above Chart Datum.
* Chart Datum is a reference datum or level from which heights and depths on a nautical chart are measured. Chart Datum is determined by the lowest astronomical tide, which is the level of the sea at its lowest possible level. It is also the reference level used to measure the depth of water in a harbour or other body of water.
If you would like space on the right of the question to write out the solution try this Thinning Feature. It will collapse the text into the left half of your screen but large diagrams will remain unchanged.
The exam-style questions appearing on this site are based on those set in previous examinations (or sample assessment papers for future examinations) by the major examination boards. The wording, diagrams and figures used in these questions have been changed from the originals so that students can have fresh, relevant problem solving practice even if they have previously worked through the related exam paper.
The solutions to the questions on this website are only available to those who have a Transum Subscription.
Exam-Style Questions Main Page
To search the entire Transum website use the search box in the grey area below.