
 |
Exam-Style Questions.Problems adapted from questions set for previous Mathematics exams. |
1. | GCSE Higher |
The midnight train to Georgia is not the most reliable. The probability that the train will be late on any day is 0.35
(a) Complete the probability tree diagram for Monday and Tuesday.
Monday Tuesday
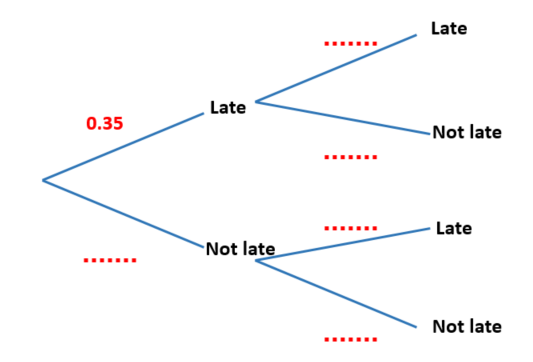
(b) Work out the probability that the train will be late on at least one of these two days.
2. | GCSE Higher |
Carol has two fair 5-sided spinners. One spinner is pink and the other is green.
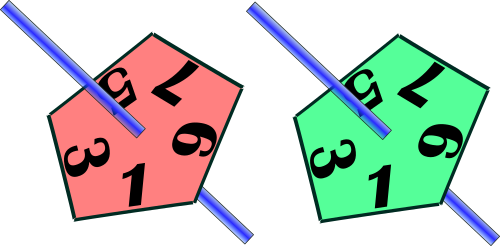
The spinners could land on any of the single digit odd numbers with equal probability.
(a) Draw a tree diagram to show the probabilities of either, or both spinners landing on a square number.
(b) Work out the probability that the pink spinner lands on a square number and the green spinner does not.
3. | GCSE Higher |
Near Blizzard Lodge on any day the probability that it snows is \( \frac{1}{4} \).
When it snows the probability that Angus goes skiing is \( \frac{4}{7} \).
When it does not snow the probability that Angus goes skiing is \( \frac{2}{5} \).
(a) In a period of 80 days on how many days is it expected to snow?
(b) Complete the tree diagram.
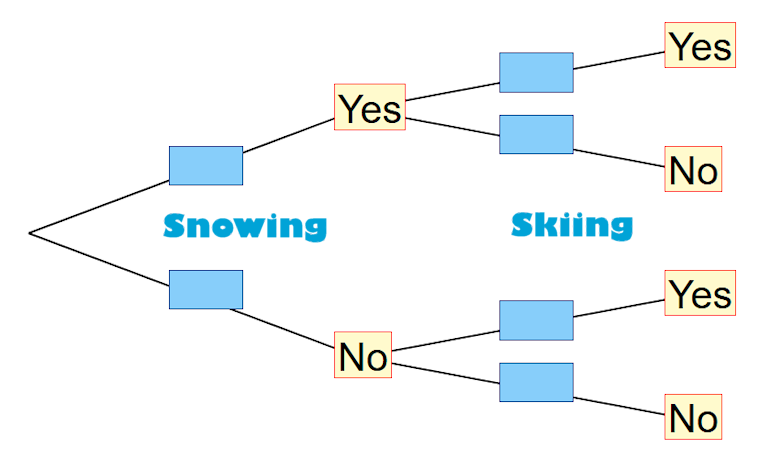
(c) Find the probability that on any day Angus goes skiing.
4. | GCSE Higher |
A driving test has two sections, practical(p) and theory(t). One day everyone who took the test passed at least one section. 77% passed the practical section and 81% passed the theory section.
(a) Represent this information on a Venn diagram showing the percentage of candidates in each section of the diagram.
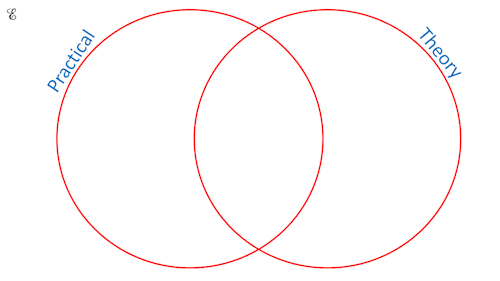
One person is chosen at random from all the people who took the test that day. What is the probability that this person:
(b) passed the practical section, given that they passed the theory section,
(c) passed the theory section, given that they passed only one section?
5. | GCSE Higher |
The Venn diagram represents a collection of 40 books on sale in an online store.
P represents the books available in paperback format.
D represents the books available in digital format.
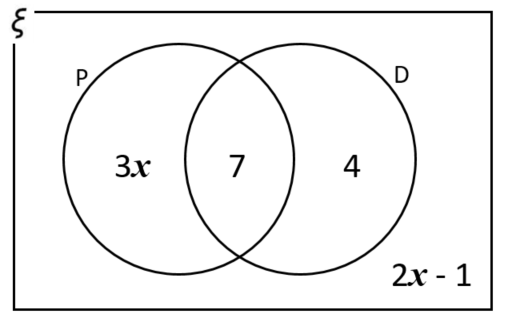
(a) One book from the collection is picked at random. Work out the probability that the book is available in digital format.
(b) One of the books that is available in paperback format is picked at random. Work out the probability that this book is also available in digital format.
6. | GCSE Higher |
At an international conference there were 300 delegates from both the northern and southern hemispheres. Each delegate wore a t-shirt in one of three different colours:
The table gives some information about the delegates.
| T-shirt colour | Total | |||
|---|---|---|---|---|
| Red | Blue | Green | ||
| Northern | 76 | 190 | ||
| Southern | 36 | 25 | 110 | |
| Total | 105 | 101 | 300 | |
(a) Complete the table.
(b) Find the probability that one of these delegates chosen at random wears a red t-shirt.
(c) Two of these delegates are chosen at random.
Find the probability that they are both from the southern hemisphere.
(d) Two of the delegates from the southern hemisphere are chosen at random.
Find the probability that they both were born after 2012.
(e) Two of the Generation Z delegates are chosen at random.
Find the probability that one is from the northern hemisphere and the other is from the southern hemisphere.
7. | GCSE Higher |
80 students are asked if they like History (\(H\)) and if they like Geography (\(G\)).
7 say they do not like History and do not like Geography.
45 say they like History.
54 say they like Geography.
(a) Draw a Venn diagram to represent this situation.
A student is chosen at random.
(b) Find the probability that this student likes History and likes Geography.
Two students are chosen at random.
(c) Find the probability that they both like Geography.
Two students who like History are chosen at random.
(d) Find the probability that they both also like Geography.
8. | IB Studies |
Sumville has three newspapers: The Chronicle, The Express and Moon, and The Scribe.
It has been found that
(a) Draw a Venn diagram to represent this information. Label A the set that represents The Chronicle readers, B the set that represents The Express and Moon readers, and C the set that represents The Scribe readers.
(b) What percentage of the population does not read any of the three newspapers?
(c) Find the percentage of the population that reads exactly one newspaper.
(d) Find the percentage of the population that reads The Chronicle or The Express and Moon but not The Scribe.
A local radio station states that 71% of the population reads either The Express and Moon or The Scribe.
(e) Use your Venn diagram to decide whether the statement is true and justify your answer.
The population of Sumville is 180 000. The local radio station claimed that 65 000 of the town’s citizens read at least two of the local newspapers.
(f) Find the percentage error in this claim.
9. | IB Studies |
900 professional footballers were surveyed with the following results
(a) Draw a Venn diagram to show this information. Use P to represent the set of footballers who have a swimming pool, H the set of footballers who have a second home and B the set of footballers who have a boat.
(b) Write down the number of footballers that have a swimming pool only;
(c) Write down the number of footballers that have a swimming pool and a boat but no second home.
(d) Write down \(n[B\cap (H\cup P)']\).
(e) Calculate the number of footballers who have none of the three.
Two footballers are chosen at random from the 900 footballers. Calculate the probability that:
(f) neither footballer has a swimming pool;
(g) only one of the footballers has a swimming pool.
The footballers are asked to collect money for charity. In the first month, the footballers collect \(x\) pounds and then they collect \(y\) pounds in each subsequent month.
In the first 6 months, they collect 15700 pounds. This can be represented by the equation \(x + 5y = 15700\).
In the first 10 months they collect 25700 pounds.
(h) Write down a second equation in \(x\) and \(y\) to represent this information.
(i) Write down the value of \(x\) and of \(y\).
(j) Calculate the number of months that it will take them to collect at least 50000 pounds.
10. | IB Studies |
Julie chooses a cake from a yellow box on a shelf. The box contains two chocolate cakes and three plain cakes. She eats the cake and chooses another one from the box. The tree diagram below represents the situation with the four possible outcomes where C stands for chocolate cake and P for plain cake.
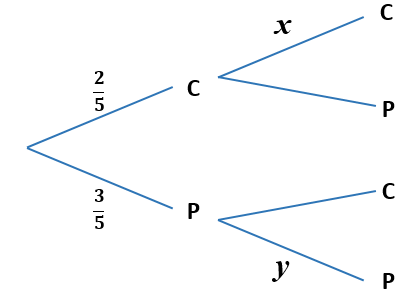
(a) Write down the value of \(x\).
(b) Write down the value of \(y\).
(c) Find the probability that both cakes are plain.
On another shelf there are two boxes, one red and one green. The red box contains four chocolate cakes and five plain cakes and the green box contains three chocolate cakes and four plain cakes. Ben randomly chooses either the red or the green box and randomly selects a cake.
(d) Copy and complete the tree diagram below.
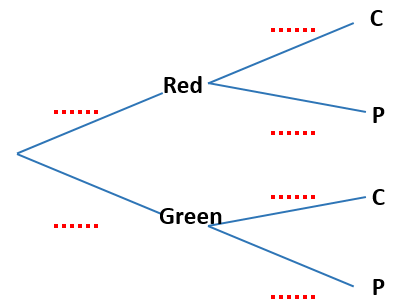
(e) Find the probability that he chooses a chocolate cake.
(f) Find the probability that he chooses a cake from the red box given that it is a chocolate cake.
11. | A-Level |
Mathsland's national currency comes in denominations of 1 unit, 5 units, 10 units and 50 units. Sofya places this collection of these coins in her purse then, without looking, takes out two coins at random, one after the other.
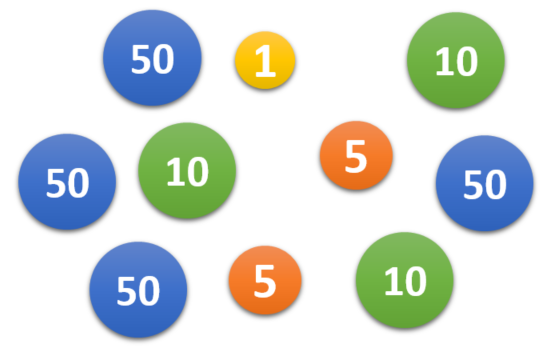
Draw a tree diagram to represent the situation and then use it to calculate the probability that the second coin that Sofya takes out of her purse has a greater value than the first.
If you would like space on the right of the question to write out the solution try this Thinning Feature. It will collapse the text into the left half of your screen but large diagrams will remain unchanged.
The exam-style questions appearing on this site are based on those set in previous examinations (or sample assessment papers for future examinations) by the major examination boards. The wording, diagrams and figures used in these questions have been changed from the originals so that students can have fresh, relevant problem solving practice even if they have previously worked through the related exam paper.
The solutions to the questions on this website are only available to those who have a Transum Subscription.
Exam-Style Questions Main Page
To search the entire Transum website use the search box in the grey area below.