Ideas for activities
Can you draw pictures with graphs?
Model real life situations by translating them into algebraic equations and by using graphs.
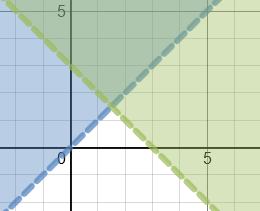
Find approximate solutions of simultaneous linear equations using graphs. For example
y = 5x - 7
3x + 2y = 1
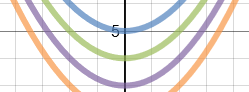
Plot families of exponential and reciprocal graphs. For example
y = 2x, y = 3x, y = 4x ...
y = 1÷x, y = 2÷x, y = 3÷x, ...
Reduce a given linear equation in two variables to the standard form y = mx + c; calculate gradients and intercepts of the graphs and then plot them to check.
Solve problems involving direct and inverse proportion using graphical representations.

Identify and interpret roots, intercepts and turning points of quadratic functions graphically.
Find the equations of the translations and reflections of graphs of given functions.
Use graphs to solve optimisation problems.

Investigate the absolute value function. Plot families of graphs and describe their characteristics. For example
y = |x2 - 5|
Plot the graphs of functions and their inverses by interchanging the roles of x and y. Find the relationship between the graph of a function and its inverse. Which functions inverses are also functions?
Related activities
For Whole ClassStraight Line Graphs 10 straight line graph challenges for use with computer graph plotting software or a graphical display calculator. |
RelatedGraph Match Match the equations with the images of the corresponding graphs. Linear, quadratic and more. |
Just For FunHuman Graphs Students should be encouraged to stand up and make the shapes of the graphs with their arms. |
SuggestedPlotting Graphs Complete a table of values then plot the corresponding points to create a linear, quadratic or reciprocal graph. |
The BasicsCoordinates This is a good place to start if you are new to this topic. Learn to read and plot coordinates. |
PracticalUsing Graphs Put those intersecting graphs to use solving simultaneous equations and quadratics. |
Graphs GameGraph Equation Pairs Match the equation with its graph. Includes quadratics, cubics, reciprocals, exponential and the sine function. |
Don's ActivityGraph Snaps Complete the tables and find the equations of the graphs that can be seen in the snaps. |
Comments


Heather Scott, Twitter
Tuesday, October 24, 2017
Tom Lucas, Bristol
Wednesday, February 21, 2018
"It would be nice to be able to draw lines between the table points in the Graph Plotter rather than just the points."
Emmitt, Wesley College
Monday, July 22, 2019
"Would be great if we could adjust the graph via grabbing it and placing it where we want too. thus adjusting the coordinates and the equation."
Ghader Yosefi, Iran
Thursday, September 19, 2019
"Thank you very much for this program. It is excellent."
João Ricardo Oliveira, Brazil
Wednesday, April 22, 2020
"First of all, congratulations for the beautiful job! But I have a question: is there a way to save/download the graphics?
[Transum: Try doing a screen grab or, if you use Windows, use the Snipping Tool]"
Alistair, UK
Monday, October 12, 2020
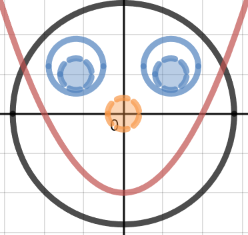
"Absoultely brilliant got my kids really engaged with graphs. Unfortunately it only plots the positive answer to the square root so the circles would not plot.
[Transum: Glad to hear they were so engaged. Yes the positive square root is the default. Try plotting the circle with the equation in the form x2 + y2 = 52 see here]"
Soumi Dana,
Sunday, January 31, 2021
"Hello, I am Soumi Dana, currently studying in 8th grade. I am very thankful for Transum and through this, my passion for math has increased. Although I don't understand much about trigonometric graphs, I have plotted some trigonometric graphs with beautiful patterns. When I know more about Trigonometry I will understand why these graphs are the way they look. For now, I love plotting them even though I don't understand them well.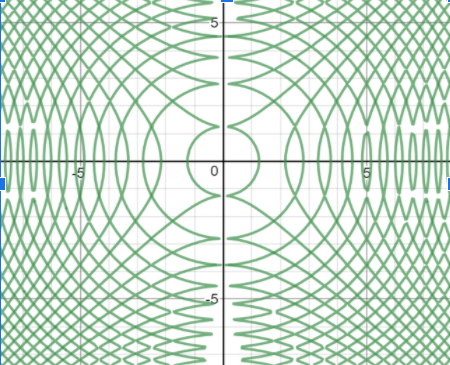 The graph above is an example. When writing the equation, cos(x²)=sin(y²) the following graph is plotted. I find it mesmerizing that an equation can give amazing results. Thank you for making Transum free and available on the internet. I am very grateful for this site.
Thank you,
Soumi."
The graph above is an example. When writing the equation, cos(x²)=sin(y²) the following graph is plotted. I find it mesmerizing that an equation can give amazing results. Thank you for making Transum free and available on the internet. I am very grateful for this site.
Thank you,
Soumi."
Akshat, India
Saturday, March 6, 2021
"Can't we plot parametric equations in this plotter?
[Transum: Yes, enter them as coordinates with the variable t. This example will draw a circle: (sin t, cos t).]"
Paul DeQuattro, Pauldeq@gmail.com, Los Angeles
Monday, May 17, 2021
"My question may not seem mathematical in nature, but here goes: mechanics and auto technicians are stumped trying to find the problem with my car engine that results in the check engine light being ON all the time. I've assumed my problem is not typical and I'm searching for a clue, any clue. I've discovered there may be some sort of linear relationship between two time periods (P1 and P2), and I'd like to show it on a graph and I'm seeking help in that regard. P1 is the time period in days or partial days wherein the car battery is completely disconnected; P2 is the time period, upon reconnecting the battery, wherein the check engine light remains OFF until it illuminates ON. My experiments have shown where P1 is greater, P2 is greater. Where P1 is a few minutes, P2 is a few minutes; where P1 is overnight (20 hours), P2 is 2-3 days; P1 is 5 days, P2 is 11 days; P1 is 10 days, P2 is 22 days; and finally, P1 is 5+ months, P2 is 5+ months. When people hear my story, their eyes glaze over and they turn off listening. I'd like to show a graph to an expert (such as an automotive electrical circuit engineer, if there is such a thing) and ask him/her to explain the relationship in my experiments. Thanks if you can comment on graphing this. Thanks for reading even if you can't"
Graham, UK Gloucester
Thursday, January 26, 2023
"Graph tool doesn’t plot y=x.e^(x/2) correctly at the inflexion point. I.e -4 , -0.541."
Russiboy,
Thursday, October 19, 2023
"cos(x²)=sin(y²) is good but have you tried sin(x²)=cos(y²)."